Introduction
To learn about more ways to visualize data, please read the following third-party tutorial:
This tutorial is an excerpt from Beginning iOS Programming with Swift by AppCoda.
Continue using your Xcode project named ChartsExamples and try out the code examples described in the tutorial.
Exercise
Using what you learned in the tutorial above, select either a pie chart or a donut chart.
Create data structures that you can model using the chart type you selected.
Then make a chart to visualize the data.
For deeper learning, if you have time, make both types of charts using your own data.
EXAMPLE
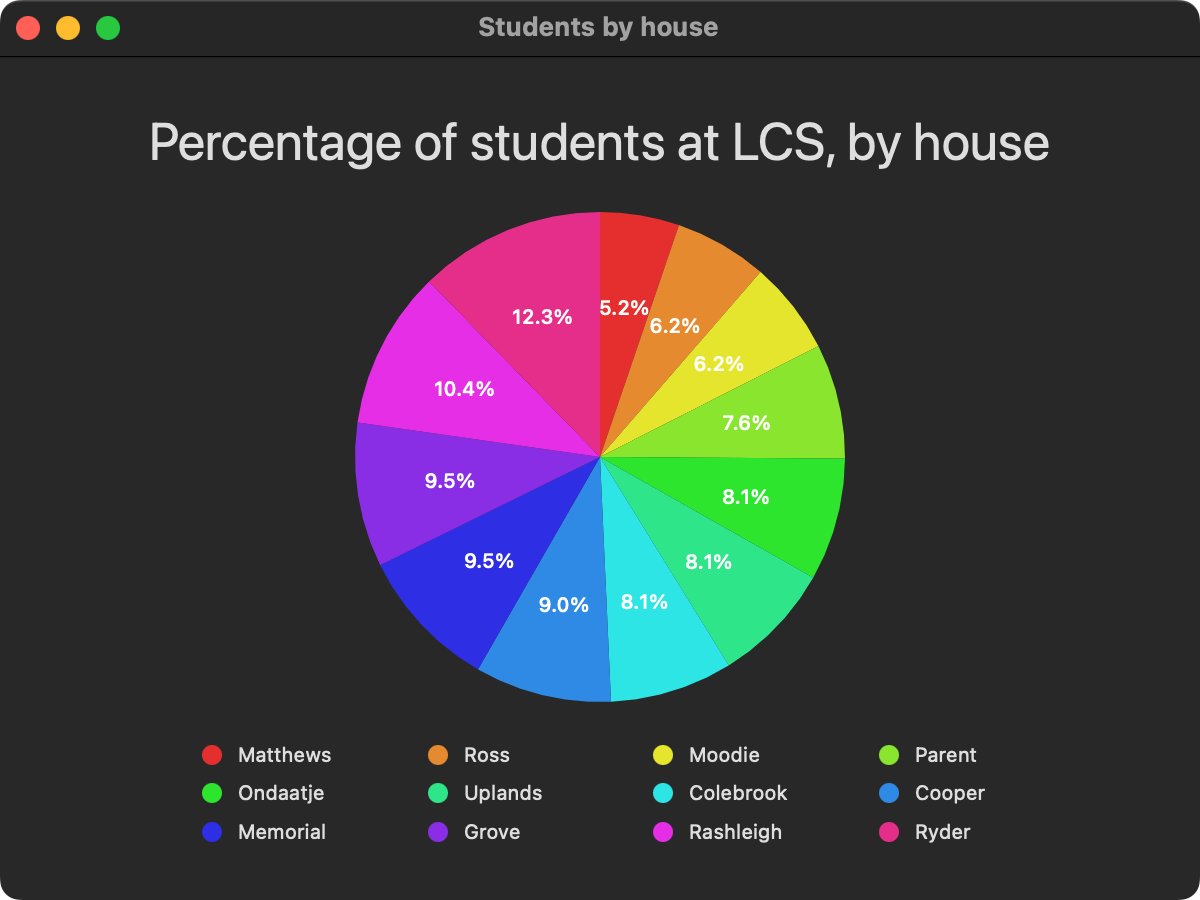
Here is an example using made-up data regarding the proportion of students in each house at Lakefield College School:
Here is a silly example, but it is good practice with making charts: